IASbaba's Daily Current Affairs Analysis, IASbaba's Daily Current Affairs May 2017, IASbaba's Daily News Analysis, UPSC

IASbaba’s Daily Current Affairs – 17th May 2017
Archives
ECONOMY
TOPIC: General Studies 2
- Indian Economy and issues relating to planning, mobilization of resources, growth, development and employment.
- Inclusive growth and issues arising from it.
New ‘Index for Industrial Production’ (IIP) series seen giving factory growth a boost
Overview:
The Industrial Output data is captured and monitored, primarily, through two statistical activities –
- Annual Survey of Industries (ASI) on an annual basis and
- Index of Industrial Production (IIP) on a monthly basis.
About Annual Survey of Industries (ASI)
The Annual Survey of Industries (ASI) is the principal source of industrial statistics in India. It provides information about the composition and structure of organised manufacturing sector comprising activities related to manufacturing processes, repair services, gas and water supply and cold storage.
The ASI is conducted annually under the Collection of Statistics Act, since 1959, to obtain comprehensive and detailed statistics of industrial sector with the objective of estimating the contribution of registered manufacturing industries as a whole to the national income.
About ‘Index for Industrial Production’
The Index of Industrial Production (IIP) is an index which shows the growth rates in different industry groups of the economy in a stipulated period of time. The IIP index is computed and published by the Central Statistical Organisation (CSO) on a monthly basis.
IIP is a composite indicator that measures the growth rate of industry groups classified under,
- Broad sectors, namely, Mining, Manufacturing and Electricity
- Use-based sectors, namely Basic Goods, Capital Goods and Intermediate Goods.
The IIP is compiled on the basis of data sourced from 16 ministries/ administrative departments. Data for IIP are collected by various source agencies under different Acts/statutes.
Issue/concern in news:
In the past few years, the month-on-month IIP has shown excessively low, and even negative growth, which subsequently turned out to be out of sync with the actual manufacturing output growth measured through the Annual Survey of Industries (ASI).
Index of Industrial Production (IIP) is a critical economic indicator, the aim of the IIP is to capture the direction and the trend of industrial production in the country, not the absolute value of industrial production. Its chief utility is as an early indicator of turning points in the economy. The IIP has been failing in serving this purpose.
Reasons for above concerns/issues:
The major reason being that IIP was measuring industrial output using baskets of production items and producing entities that had remained unchanged since 2004-05.
Meaning – The standard procedure followed was that a list of items was constructed in the base year and for each item the producing entities were identified. This structure was frozen.
In simple words, the IIP index was constructed with the output figures received month over month from the baskets of items and entities fixed in the base year. (It did not consider new entities or changes)
I.e., if an entity shut down, its output fell to zero. But since the basket was frozen no new entity could be taken in place of the zero-output one.
For instance, say Calculators may fall out of use and more smartphones may be consumed. The IIP was not equipped to capture such changes in the economy.
The way ahead:
- Revised Base Year
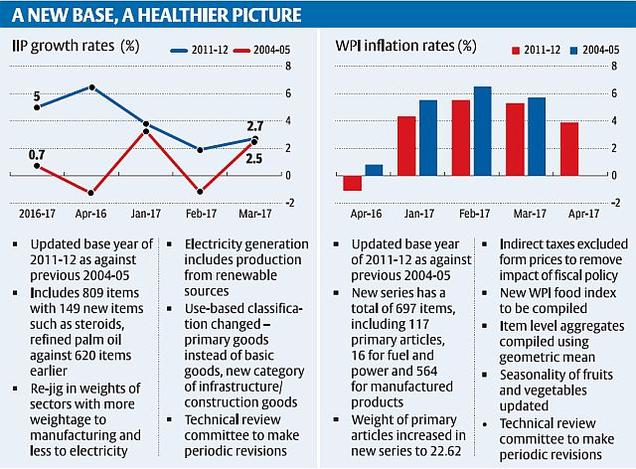
- Therefore, the Central Statistics Office (CSO), Ministry of Statistics and Programme Implementation revised the base year of Index of Industrial Production (IIP) and Wholesale Price Index (WPI) to 2011-12 base years, replacing the 2004-05 base years. Analysts believe that the new series will be able to capture the current state of affairs of the economy by replacing the old basket of goods with a contemporary one.
- Currently the IIP and WPI take 2004-05 as base year, while the GDP and Consumer Price Index (CPI) data are calculated using the base year of 2011-12. Using the same base year of 2011-12 for all macroeconomic data indicators will ensure that accuracy is maintained in the mapping of economic activity.
- The new base year has been selected keeping in view the base year of other macroeconomic indicators namely Gross Domestic Product (GDP), Consumer Price Index (CPI). Several changes have been made in the new series of the IIP in order that new IIP is able to reflect the changes in the industrial sector in a more representative and robust manner.
What is Base Year?
Base-year is the year used for comparison for the level of a particular economic index. The arbitrary level of 100 is selected so that percentage changes can easily be depicted.
- A more dynamic index with expanded coverage and representative IIP
- IIP is being made more dynamic. First, the Central Statistics Office has updated its base year to 2011-12. The revision is aimed at capturing the changes that have taken place in the industrial sector since 2004-05.
- New products have been included in the items basket, and those that have lost their relevance deleted. Renewable energy, for example, has been included in the electricity index. The expanded coverage — 809 items against 620 earlier, and a larger number of factories — is expected to make the IIP more representative.
- Second, instead of the periodic baskets revisions, a permanent standing arrangement is being put in place to make sure that the IIP remains representative. In other words, a technical committee will be constituted to continuously review the item basket, the reporting entities and the method of coverage.
What does the updated IIP offer?
- The updated IIP offers new insights and a healthier picture, the most important being, the average industrial output growth of the last five years (2011-12 to 2016-17) in the old IIP is 1.38%, and in the updated series it is 3.8%.
- On the manufacturing front, the average five-year growth has improved to 4.04% against 0.94% in the old IIP.
- However, the output growth of the infrastructure and construction sector has slowed down from 5.7% in 2013-14 to 3.8% in 2016-17 despite the government’s sustained push to the infrastructure sector, including through substantial increases in targeted public spending , in the last three years.
- The updated IIP also shows a modest recovery in the capital goods sector, a barometer of the investment sentiment. From -3.6% in 2013-14, output growth in the sector improved to 1.9% in 2016-17.
Link: http://www.thehindubusinessline.com/multimedia/dynamic/03163/bl13_IIP_graphics_3163912f.jpg
The main driver of growth in the economy remains consumption. Consumer durables grew 6.2% and non-durables 9% in 2016-17. The Seventh Pay Commission award to Central government employees and pensioners last year seems to have spurred consumption.
Demonetisation’s debilitating impact on manufacturing is visible in the updated monthly IIP for 2016-17. The average output growth for the seven months from April to October was 6.8%, and for the five months from November to March 2.28%. The IIP’s coverage by design is limited to the organised sector. The disruption in the unorganised sector is expected to get measured in the ASI.
Conclusion:
It is widely acknowledged that the IIP numbers are an important input while estimating the GDP. Given the fact that now the base years of all the major macroeconomic indicators, the Gross Domestic Product (GDP) and the Wholesale Price Index, are aligned to — 2011-12, it is possible that the GDP numbers too could be revised upwards.
Instead of the periodic baskets revisions, a permanent standing arrangement will make sure that the IIP remains representative. There is need of monitoring and mapping of the index with the changes taking place in the economy.
Fast recap and important points to remember:
- IIP in the new series will continue to consist of three sectors viz. Mining, Manufacturing and Electricity, as in the existing series.
- The National Industrial Classification 2008 will be followed in the new series for the purpose of classification of products as per industries.
- The Use-Based Classification has been revised to reflect the industrial segments and production more accurately as well as to map the products more accurately as per their use in the industries. The new use based classification includes Primary Goods, Intermediate Goods, Infrastruture/Construction Goods, Capital Goods, Consumer Durable Goods and Consumer Non Durable Goods.
- The coverage of the new series of IIP is limited to the Organized Sector only.
- For enabling dynamic revision of the methodology of IIP including the item list and the panel of factories during the currency of a base year, a Technical Review Committee, chaired by Secretary, Ministry of Statistics &PI, will be constituted.
- Due to the increasing significance of the electricity generation from renewable sources, it has been decided to include the same in the electricity generation figures for compilation of IIP in the new series.
- The new series show higher growth rates in most months in the period April 2012 to March 2017, as compared to the existing series which is attributable to
- shifting of base to a more recent period;
- increase in number of factories in panel for reporting data and exclusion of closed ones and
- inclusion of new items and exclusion of old ones.
Connecting the dots:
- Highlight some of salient features of the new IIP series with revised base year 2011-12.
- Discuss the differences between Annual Survey of Industries (ASI) and Index of Industrial Production (IIP) and examine how the new IIP series gives factory growth a boost.
NATIONAL/AGRICULTURE
TOPIC:
General Studies 2
- Government policies and interventions for development in various sectors and issues arising out of their design and implementation.
General Studies 3
- Major crops cropping patterns in various parts of the country;
- Transport and marketing of agricultural produce and issues and related constraints;
- e?technology in the aid of farmers
- Issues related to direct and indirect farm subsidies and minimum support prices; Public Distribution System – objectives, functioning, limitations, revamping; issues of buffer stocks and food security;
Agriculture Marketing
Introduction
Indian agriculture is a gamble with monsoon is an old adage. It is a gamble with almost everything is now a reality. Risks are multipronged and this makes it difficult for the farmers to raise their standard of living and hence suffer.
Issue:
- Farmers in some States are regretting their abundant yields this year as the prices of agricultural commodities have crashed.
- Chilli farmers in Andhra Pradesh and Telangana, tomato growers in Karnataka, and toor dal cultivators in Maharashtra are at the centre of a severe crisis that has witnessed prices fall by more than half in a matter of just weeks.
- Some speculate that high commodity prices last year caused farmers to respond by boosting production, which in turn led to the present price crash.
- Whether it is the wholesale mandis where farmers sell their agricultural produce, or retail outlets where consumers buy them, price fluctuations are common.
- But whether such fluctuations can be explained as being due to mindless crop cultivation, as some speculate, is not as certain.
- For one, in the consumer market, commodity speculators usually dampen price fluctuations by managing supply according to consumer demand.
- For instance, when the supply of grains is abundant, speculators do not flood the market with all their stock but instead hoard the grains and sell them later when supply turns scarce.
- Thus, even if farmers engage in mindless grain production, speculators usually save the day for consumers by preventing steep rises and falls in grain prices.
Price fluctuations – resultant concerns
- In the wholesale market, speculators can save farmers from similar price fluctuations by paying a competitive price for their produce even when there is abundant supply.
- Grain traders, to return to our previous example, who want to hoard supply expecting higher grain prices in the future would be willing to pay a better price to farmers today.
- This comes not out of compassion for farmers, but purely out of competition with other grain traders.
- When farmers are free to sell their produce to any trader they want, it is traders paying the best price who get hold of it.
- Farmers can also expect a more predictable price for their produce each season, reflecting stable consumer prices, thus preventing mindless cultivation.
Need for competition:
- Such competition though is clearly missing from the Indian agricultural scene where the supply chain is broken.
- Red tape, including limits on stocking agricultural products, has prevented the growth of a robust market for commodity speculation.
- The result is lack of investment in infrastructure like that of cold storage; about 40% of agricultural produce in India is wasted because of it.
- This, in turn, has led to price fluctuations that have affected both the farmer and the consumer.
- Wholesale agricultural prices are determined by trader cartels that block competitive bidding.
- This significantly reduces the price farmers can get for their products, while boosting the profits of some privileged traders.
- By some estimates, farmers receive only 20-25% of what the final consumer pays for his product.
- Thus, a free market in agriculture can be the best solution to the crisis facing Indian farmers.
Conclusion:
Suggestion of a free market in agriculture looks ideal on paper. But the implementation challenges will be critical for an age old occupation and remote reach it has. The need is for innovative solutions like e-NAM and some legislative reforms.
Connecting the dots:
- Critically analyse the need for legislative reforms and policy solution to improve agricultural marketing scenario in India.
MUST READ
Held at ransom: on the recent ransomware attacks
Turning down China
The majority complex
After the no-show
The belt and road to China’s hegemony in Asia
Gender discrimination defines India’s economy
Too many spies spoil the intelligence broth
Downright hypocritical
GM mustard deserves the green signal
How will GST impact MSMEs?
For a dedicated peer group, Motivation & Quick updates, Join our official telegram channel – https://t.me/IASbabaOfficialAccount
Subscribe to our YouTube Channel HERE to watch Explainer Videos, Strategy Sessions, Toppers Talks & many more…


