The Big Picture- RSTV

Decoding Employment Data
Archives
TOPIC: General Studies 3
- Indian Economy and issues relating to planning, mobilization of resources, growth, development and employment.
- Inclusive growth and issues arising from it.
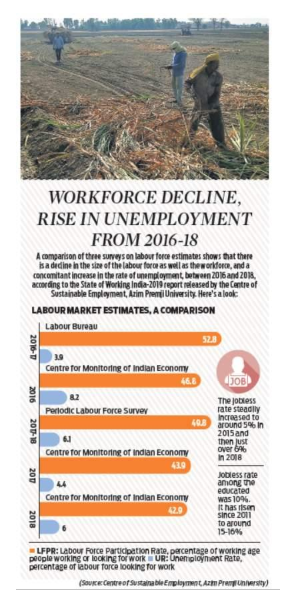
In News: India’s unemployment rate stood at 6.1% in FY18.
- As per the PLFS, which covered 4.3 lakh people across 1.02 lakh households, the unemployment rate among urban workforce was 7.8 per cent, while the unemployment rate for the rural workforce was 5.3 per cent.
- The unemployment rate of males on all-India basis was 6.2 per cent, while it was 5.7 per cent in case of females.
- In the organised manufacturing sector, though the number of jobs has grown, there has also been an increase in the share of contract work, which offers lower wages and less job security, according to the study.
- Labour productivity in the sector is six times higher than it was 30 years ago; however, managerial and supervisory salaries have only tripled in the same period, while production workers’ wages have grown a measly 1.5 times.
- Women’s participation in the paid workforce is still low, but the situation is unequal across States. In Uttar Pradesh, only 20 women are in paid employment for every 100 men, while that figure jumps to 50 in Tamil Nadu and 70 in Mizoram and Nagaland.
- With regard to earnings, the caste gap is actually larger than the gender gap. Dalits and Adivasis are over-represented in low-paying occupations, and severely under-represented in higher-paying ones, the study reveals. They earn only 55-56% of upper caste workers’ earnings, the data shows.
The Issue
The data isn’t comparable with that of past years, the government contended, in effect seeking to refute previous leaked reports that said they showed the unemployment rate was at a 45-year high.
- The Periodic Labour Force Survey of the National Sample Survey Office released on Friday showed the unemployment rate in the country in FY18 was at 5.3% in rural India and 7.8% in urban India, resulting in overall unemployment rate of 6.1%.
- The joblessness among males on all India basis was 6.2 per cent, while it was 5.7 per cent in case of females.
Inference:
- First, while the unemployment rate is a frequently used measure of poor performance of the economy, under conditions of rising school and college enrolment, it paints an inaccurate picture.
- Second, the reported unemployment rate is dominated by the experience of younger Indians who face higher employment challenges and exhibit greater willingness to wait for the right job than their older peers.
- Third, the unemployment challenge is greatest for people with secondary or higher education, and rising education levels inflate unemployment challenges.
These three conditions, taken together, suggest that part of India’s unemployment challenge lies in its success in expanding education while not expanding formal sector jobs.
Rural Numbers
- Indicating a shift towards rise in self-employment over the last eight years in rural areas, the Periodic Labour Force Survey 2017-18 shows that the percentage of self-employed in rural India went up across both male and female as against that seen in 2009-10
- While the percentage of salaried employees in rural areas also witnessed a rise during this period, there has been notable drop in the percentage of casual labour in rural areas as they moved away from agricultural labour to self-employment and salaried jobs.
- While the percentage of rural self-employed stood at 53.5 per cent in 2009-10 among men, that in 2017-18 stood higher at 57.8 per cent. Similarly, in case of rural women, the percentage of self-employed rose from 55.7 per cent to 57.7 in the same time period.
- On the contrary, the percentage of men casual labour in rural areas went down from 38 per cent in 2009-10 to 28.2 per cent in 2017-18, percentage of women casual labour in rural areas fell from 39.9 per cent to 31.8 per cent in the same time period.
Periodic Labour Force Survey (PLFS)
As the domestic labour market is becoming increasingly sensitive to national and global economic factors, policymakers felt the need to construct labour statistics at more frequent intervals. To fulfil this objective, the Periodic Labour Force Survey (PLFS) was initiated by the NSSO beginning April 2017. This initiative followed the recommendations of the Task Force on Improving Employment Data. The PLFS is a continuous survey for generating estimates of labour force indicators on a quarterly basis for urban areas and on an annual basis for both rural and urban areas.
The Way Forward
- Unemployment rate among persons with higher secondary education and above ranges between 7.4 per cent and 16.3 per cent:
This clearly suggests that the problem of unemployment among educated youth cannot be ignored. However, the real issue at hand is not solely of job creation but also of the creation of quality jobs. In the din generated by the PLFS survey, this critical issue has escaped attention.
The problem can be assessed from a demand and supply side perspective. On the one hand, higher growth has raised the youth’s aspirations for more meaningful jobs, thereby leading to a mismatch between jobs offered and jobs that educated youth are looking for. On the other hand, in today’s era of the fourth Industrial Revolution, young people need to be equipped with necessary skills to work with new technologies. As we have a larger than ever population of educated unemployed, India does not need jobs per se but meaningful, remunerative jobs that align with the aspirations of the youth and skills demanded by the industry. The problem is not unique to India. As per an IMF report, youth inactivity rate for India, at 30 per cent is similar to 25-30 per cent youth inactivity rates in other emerging and developing countries.
- Obtaining a reliable estimate of informal employment, which constitutes about 80 per cent of our labour force, remains a challenge:
The unemployment story will never be complete until we are able to accurately capture performances across all segments of the labour market for meaningful inference. At the same time, we must recognise that perceptions about earnings and jobs are changing fast in the wake of rapid technological advances. The true meaning of being a worker is shifting towards having stable, productive and remunerative employment. This aspect must be captured both at the stage of collection of labour data, and while interpreting and analysing the same for evidence-driven policy-making.
- Need for an employment-oriented economic policy:
Even as we shift towards macroeconomic policies that maintain the level of aggregate demand, we can assist the unemployed by strengthening the employment programme we already have, namely the Mahatma Gandhi National Rural Employment Guarantee Scheme (MGNREGS). Three actions may be taken towards this end. First, there have been reports that though the budgetary allocation for the scheme may have increased, workers face delay in payment. This is unacceptable, especially in this digital era when beneficiary identification and money transfer are cheap and reliable. Second, as has been suggested, there is a case for extending the MGNREGS to urban India for there is unemployment there. Of course, some rationalisation of existing public expenditure would be needed to generate the fiscal space needed, but we may yet expect a positive sum outcome when this is done imaginatively.
- Measurement of Unemployment Numbers
Monthly measurement of the unemployment rate is one of the requirements of the Special Data Dissemination Standard (SDDS) of the International Monetary Fund (IMF). The SDDS — India was one of the early signatories —was established in 1996 to help countries access the international capital markets by providing adequate economic and financial information publicly. India complies with many requirements of the SDDS, but it has taken an exception with respect to the measurement of unemployment.
The Government of India does not produce any measure of monthly unemployment rate, nor does it have any plans to do so. Official plans to measure unemployment at an annual and quarterly frequency is in a shambles. This does not befit India’s claims to be the fastest growing economy and as the biggest beneficiary of a famed demographic dividend.
Creating jobs for an increasingly educated workforce and ensuring that the new workers are well equipped to enter the labour force are twin challenges that deserve greatest priority.
Slowing job growth can be disastrous for society. It will not only widen the economic gap within society, but it will also deepen social friction and cause tears in our social fabric, possibly leading to greater violence and political chaos. The new government will have to focus on an economic agenda without much loss of time. The two most pressing issues are growth acceleration, and creation of productive employment.
Note:
PM ordered the formation of two new Cabinet committees that will focus on employment and economic growth, respectively
- The Cabinet Committee on Employment and Skill Development constitutes of 10 members including Union Home Minister Amit Shah, Finance Minister Nirmala Sitharaman, Railway Minister Piyush Goyal, Union Ministers Narendra Singh Tomar, Ramesh Pokhriyal, Dharmendra Pradhan, Mahendra Nath Pandey, Santosh Kumar Gangwar, and Hardeep Singh Puri.
- The Cabinet Committee on Investment and Growth comprises of five members including Amit Shah, Nirmala Sitharaman, Nitin Gadkari, and Piyush Goyal.
Consumer Pyramids Household Survey (CPHS): The CPHS is comprehensive, surveying its entire sample every four months. Each survey is a wave. The CPHS is also a continuous survey, and so, for example, three waves are completed in a year. The CMIE’s CPHS thus has a much larger sample and is conducted at a much higher frequency than the NSSO’s.
Further, the CPHS is conducted as face-to-face interviews necessarily using GPS-enabled smartphones or tablets. Intense validation systems ensure high fidelity of data capture. All validations are conducted in real-time while the teams are in the field. The data capture machinery ensures delivery of high quality data in real time obviating the need for any further “cleaning”, post field operations.
Once the data is collected and validated in real-time, it is automatically deployed for estimations without any human intervention.
In 2016, the Centre for Monitoring India Economy (CMIE) added questions regarding employment/unemployment to the CPHS. Since then, the CMIE has been generating labour market indicators regularly and making these freely available for public use.
Difference between the CPHS and the NSSO surveys: The reference period of the employment status of a respondent.
While the NSSO tries to capture the status for an entire year and for a week, the CPHS captures the status as on the day of the survey. This could be as one of four factors: employed; unemployed willing to work and actively looking for a job; unemployed willing to work but not actively looking for a job, and unemployed but neither willing nor looking for a job.
Since the recall period in the CPHS is of the day of the survey (or the immediate preceding day in the case of daily wage labourers) and the classification is elementary, the CPHS has been able to capture the status fairly accurately with no challenges of the respondent’s ability to recall or interpret the status. In contrast, the NSSO’s system is quite complex.
Connecting the Dots:
- Is there really a need for National Employment Policy? Discuss.
For a dedicated peer group, Motivation & Quick updates, Join our official telegram channel – https://t.me/IASbabaOfficialAccount
Subscribe to our YouTube Channel HERE to watch Explainer Videos, Strategy Sessions, Toppers Talks & many more…