IASbaba's Daily Current Affairs Analysis, IASbaba's Daily Current Affairs July 2015, Science and Technology, UPSC

Archives
IASbaba’s Daily Current Affairs- 21th July, 2015
NATIONAL
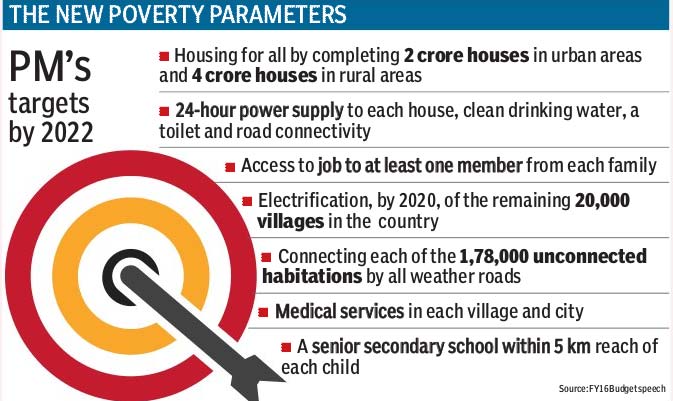
Poverty estimation in India
Recently, the government released data from the Socio-Economic Caste Census (SECC) 2011. There has been comment that hereafter, we need not have consumption-based poverty estimates using NSS (National Sample Surveys) data. It is thought that SECC data will alone be enough to estimate poverty and deprivation.
What is the difference between NSS and SECC?
- NSS consumption-based poverty estimates are still relevant.
- SECC-based estimates are important, but no substitutes for NSS-based poverty ratios.
- Estimates based on SECC and NSS data have different purposes.
What are the different studies on poverty measurement?
- The methodology for the estimation of poverty used by the erstwhile Planning Commission was based on recommendations made by various expert groups.
- The Rangarajan expert group has gone back to the idea of separate poverty line baskets for rural and urban areas, unlike the Tendulkar Committee, which took urban poverty as a given and used it as the common basket for rural and urban households.
What is the present basis for poverty line?
- Based on the analysis presented in the expert group report, monthly per capita
 consumption expenditure of Rs 972 in rural areas and Rs 1,407 in urban areas is treated as the poverty line at the all-India level.
 - Assuming five members for a family, this will imply a monthly per household expenditure of Rs 4,860 in rural areas and Rs 7,035 in urban areas.
- The expert group estimates that 30.9 per cent of the rural population and 26.4 per cent of the urban population were below the poverty line in 2011-12.
- The all-India ratio was 29.5 per cent.
IAS BABA’s View
- Poverty estimates provide the proportion and size of the poor population and their spread across states and broad regions.
- But they cannot be used for identification of the individual poor, which is necessary to ensure that the benefits of programmes and schemes reach only the deserving and targeted group.
Connecting the Dots:
- What is the rationale for having poverty estimates based on consumption estimates?
- What are the various Income and non-income indicators of poverty?
ECONOMICS
Diverging CPI, WPI: The inflation conundrum
- The two main inflation indicators – the Wholesale Price Index (WPI) and the Consumer Price Index (CPI) are moving in widely divergent directions. In the last eight months, while CPI (retail inflation) has consistently moved upwards, the WPI (headline inflation) has dramatically contracted, leaving a substantial 7.8 % point gap between these two inflation estimates.
- The development has posed a problem for policy makers as while the movement of consumer prices makes out a case for higher interest rates, the wholesale price movement demands urgent reduction in key interest rate.
The recent trend of WPI :
- The headline inflation (WPI) covers the entire production chain and measures inflation across the spectrum. It has been declining due to the significant fall in the global commodity prices, leading to a decline in the prices of raw materials.
- WPI is more affected by the international prices, since manufacturing has a higher weightage in WPI (while food is given higher weightage in CPI). International marked are predominated by the manufacturing goods.
- The headline inflation has been on the downward trend since June 2014 when it stood at 5.66 %, subsequently falling to 1.66% in October, turning zero in November and then entering into the negative zone in January 2015 when it stood at -0.95 %.
Why has CPI remained high?
- The main reason is lack of competitive integrated market – this is the reason why price changes at the upstream level, i.e., the raw material, intermediate goods and capital goods, don’t get reflected in the final products and eventually in the CPI.
- Lack of proper infrastructure – inefficient forward and backward linkages leading to wastages and higher cost.
Reasons for the divergence between the two indices- WPI and CPI and its Impact:
- Variation in base years – While WPI is measured on base year 2004-05, CPI is measured on base year 2012. The government moved to the new base year for CPI from January 2015.
- Composition –The basket of items and weights allocated to the individual items in the two indices, is also different with cost of transportation and rent on housing being a part of the CPI and not WPI.
- End consumers overburdened – Though the prices of raw materials have gone down considerably, it is not getting reflected in the final price of the product as it is not passed on to the consumers. There is a huge profit margin made by the users.
- While profit margins are a significant factor in the CPI divergence, corporate profits have not really gone up much so as to define the current gap between the two indices.
- Same is the case with fuel prices – Though the fuel prices too have come down sharply, the government has not passed the benefit of a benign fuel prices to customers. That has been used to reduce subsidies and strengthen the fiscal position.
What should the ideal difference between CPI and WPI be?
- According to economists, ideally CPI should not be more than 1% point of WPI on either side. Headline inflation in June 2015 was -2.4 % while the retail inflation was 5.4 % during the month.
Some experts Opinion/Views:
For WPI – WPI should be used to measure inflation because Indian markets are not integrated.
For CPI – In economies where such integrated markets exist, CPI is the ideal measure. In such markets, both CPI and WPI should move in tandem.
Balanced view – While WPI can be used as a more effective measure of inflation, CPI can be used for inflation targeting by the RBI because it has to maintain the real interest rate and therefore has to target CPI because retail consumers are impacted by it.
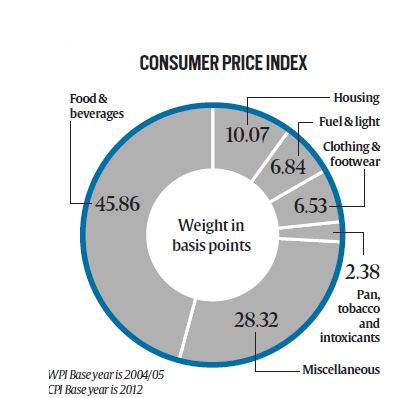
The below picture indicates the weightage given to different commodities under CPI and WPI
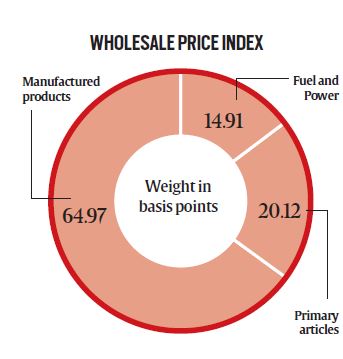
Composition of WPI:
- Around 12% of the basket consists of primary articles. This includes food articles such as cereals, meat, fish, fruits and vegetables. It also includes non-food articles such as cooking oil, cotton, jute and minerals.
- Fuel and power (14.91%) includes elements such as electricity, mineral oils and coal. Items such as kerosene, diesel, liquefied petroleum gas and petrol also fall in this category.
- Manufactured goods (64.9%)- There are many sub-groups in this category; some of the main ones are chemical and chemical products, basic metals, alloys and metal products, food products, machinery and machine tools and textiles.
- Changes in bulk prices of items in the WPI basket may not affect one’s spending directly but ultimately this trickles down to retail prices as well.
Composition of CPI:
- Earlier the CPI was compiled for three segments—industrial, agricultural and rural workers. However, in 2012 this got changed and is now compiled as urban household and rural household linked CPI.
- This is relevant because the consumption patterns vary vastly in urban and rural India. The CPI is like your shopping basket. The new CPI has five sub-groups including food and beverages, fuel and light, housing and clothing, bedding and footwear.
- The weightages differ for the rural and urban baskets. For example, the urban basket has a much higher weightage to housing related items.
- Unlike the WPI, this is more relevant to an individual’s daily expenditure.
Connecting the Dots:
- In the Indian context, is CPI the right measure of inflation?
- Should India use both the indices (CPI, WPI) for inflation measurement and inflation targeting/ inflation control? Give your arguments and substantiate.
- What are the steps taken by the govt. and RBI with regard to the same
SCIENCE & TECHNOLOGY
ISRO tests indigenous cryogenic engine
- An indigenous cryogenic rocket engine being developed to power India’s most
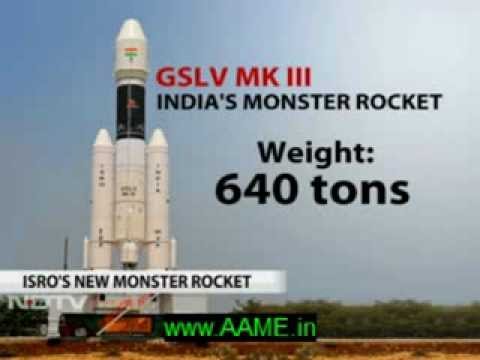 powerful rocket system, the GSLV Mk III, underwent a successful endurance test for duration of 800 seconds at ISRO’s propulsion complex at Mahendragiri.
 - The cryogenic engine which will power the upper stage of the GSLV Mk III was fired for a period that is 25 per cent longer than required in a space flight with a nominal thrust of 19 tones and its performance matched prediction made through computer simulation.
What is the Difference between GSLV and PSLV?
- Both PSLV (Polar Satellite Launch Vehicle) and GSLV (Geosynchronous Satellite Launch Vehicle) are the satellite-launch vehicles (rockets) developed by ISRO.
- PSLV is designed mainly to deliver the “earth-observation” or “remote-sensing” satellites with lift-off mass of up to about 1750 Kg to Sun-Synchronous circular polar orbits of 600-900 Km altitude.
- The GSLV is designed mainly to deliver the communication-satellites to the highly elliptical (typically 250 x 36000 Km) Geosynchronous Transfer Orbit (GTO).
- The satellite in GTO is further raised to its final destination, viz., Geo-synchronous Earth orbit (GEO) of about 36000 Km altitude (and zero deg inclination on equatorial plane) by firing its in-built on-board engines.
How cryogenic C25 operates?
- The cryogenic C25 stage engine operates on Gas Generator Cycle using extremely low temperature propellants Liquid Hydrogen at 20 Kelvin (-253 degree C) and Liquid Oxygen at 80 Kelvin (-193 degree C).
- The successful endurance hot test of the first high thrust cryogenic engine is the tenth test in a series planned as part of the development of the engine employing complex cryogenic technology.
What are the applications of Cryogenic Engine?
- Aerospace-cryogenic engines
- Medical Field
- Manufacturing field
- Electronics Field
- Fuels Research
IAS BABA’s View
- This new rocket will be capable of doubling the capacity of payloads India can carry into space.
- GSLV Mk-III is conceived and designed to make India self-reliant in launching heavier communication satellites of INSAT-4 class, which weigh 4,500 to 5,000 kg.
- It will also enhance the capability of the country to be a competitive player in the multimillion dollar commercial launch market.
Connecting the dots:
- Write a note on India’s first indigenously designed and developed high thrust cryogenic rocket engine.
- Make a note on various important subsystems designed.
Tit-bits:
Rajya Sabha panel gives nod for GST bill
- The approval sets the stage for the bill’s introduction in the upper House and eventual implementation from 1 April 2016
- GST, a new indirect tax regime aims to create a national common market.
For detailed information on GST, refer our previous articles News Analysis (Current Affairs)