Economics

In News: As many as 41.5 crore people exited poverty in India during the 15-year period between 2005-06 and 2019-21, out of which two-thirds exited in the first 10 years, and one-third in the next five years, according to the global Multidimensional Poverty Index (MPI).
- Improvement in MPI for India has significantly contributed to the decline in poverty in South Asia.
Dimensions of Poverty:
- Absolute poverty – income below a certain threshold necessary to meet basic necessities of life (food, shelter, clothing, rent)
- Relative poverty – Individuals receiving income a certain level (e.g. 50%) below the median income of the general population.
- Persistent poverty – This is defined as a household which is below the poverty threshold line for 2 out of the past 3 years.
- Headcount Index – It is a widely-used measure, which simply indicates the proportion of the poor to total population. It does not indicate how poor the poor are.
- Poverty gap index – It is the ratio by which the mean income of the poor falls below the poverty line.
- The Sen index – It is a composite poverty measure, which combines incidence and intensity of poverty risk with the distribution of income among those at risk of poverty.
Global Multidimensional Poverty Index:
- It is a report produced by the United Nations Development Programme (UNDP) and the Oxford Poverty and Human Development Initiative (OPHI)
- The global MPI constructs a deprivation profile of each household and person through 10 indicators spanning health, education and standard of living. All indicators are equally weighted within each dimension.
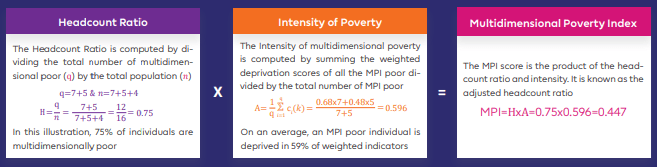
- The global MPI identifies people as multidimensionally poor if their deprivation score is 1/3 or higher.
- The MPI is calculated by multiplying the incidence of poverty and the average intensity of poverty.
- The MPI ranges from 0 to 1, and higher values imply higher poverty.
- By identifying who is poor, the nature of their poverty (their deprivation profile) and how poor they are (deprivation score), the global MPI complements the international $1.90 a day poverty rate, which was revised by the World Bank last month to $2.15 per day.
- India ranked 62 in the Global MPI 2020 which ranked 107 countries.

Findings of the report:
- The incidence of poverty fell from 55.1% in 2005/06 to 16.4% in 2019/21 in the country.
- Deprivations in all 10 MPI indicators saw significant reductions as a result of which the MPI value and incidence of poverty more than halved.
- Globally, of the total 610 crore people across 111 developing countries, 19.1% or 120 crore live in multidimensional poverty. Nearly half of them live in severe poverty.
- The report doesn’t fully assess the effects of the COVID-19 pandemic on poverty in India as 71% of the data from the National Family Health Survey-5 (2019-2021) relied upon for MPI were collected before the pandemic.
- The report also notes that for India, the relative reduction from 2015/2016 to 2019/21 was faster: 11.9% a year compared with 8.1% from 2005/2006 to 2015/2016. This is unsurprising because relative poverty reduction is easier to achieve when starting levels of poverty are lower.
- Bihar, the poorest State in 2015/2016, saw the fastest reduction in MPI value in absolute terms. The incidence of poverty there fell from 77.4% in 2005/2006 to 52.4% in 2015/2016 to 34.7% in 2019/2021.
- Improvement in MPI for India has significantly contributed to the decline in poverty in South Asia.
- It is for the first time that India is not the region with the highest number of poor people, at 38.5 crore, compared with 57.9 crore in Sub-Saharan Africa.
Significance of MPI:
- Wide coverage across the length and breadth of the country and has international comparability.
- The MPI is, in principle, able to make statements about the extent of global multidimensional poverty in a way the World Bank’s $1 a-day poverty line makes about global absolute income poverty.
- More reliable database than the one used for the income poverty measure, where the comparability of survey instruments across country and over time is much less certain.
- Since it is based on household survey information, it is much more actionable and a policy-relevant indicator for countries and agencies than the HDI.
- One can decompose the MPI by region, by particular groups, and by indicator, thereby allowing countries to directly see which groups suffer most and in which dimensions they are deprived.
Poverty Challenges in India:
- India has by far the largest number of poor people worldwide at 22.8 crore, followed by Nigeria at 9.6 crore.
- Two-thirds of these people live in a household in which at least one person is deprived in nutrition.
- There were also 9.7 crore poor children in India in 2019/2021- more than the total number of poor people, children and adults combined, in any other country covered by the global MPI.
- Of the 10 poorest States in 2015/2016, only one (West Bengal) was not among the 10 poorest in 2019/2021. The rest— Bihar, Jharkhand, Meghalaya, Madhya Pradesh, Uttar Pradesh, Assam, Odisha, Chhattisgarh and Rajasthan —remain among the 10 poorest.
- While poverty levels have not worsened, levels of under-nutrition are still very high. There is no marked acceleration in rate of improvement between NFHS-3 and NFHS-4 and NFHS-4 and NFHS-5. And the MPI mainly captures the pre-COVID situation because 71% of the NFHS-5 interviews were pre-COVID.
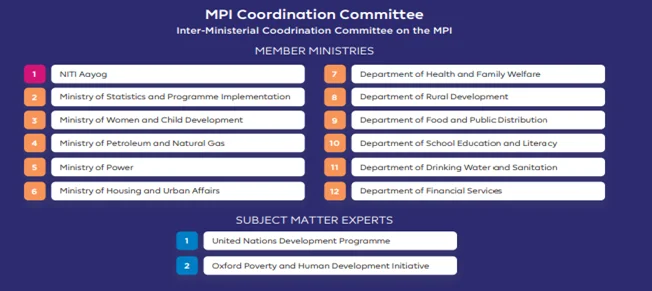
India’s Multidimensional Poverty Index:
- Steered by the Government of India’s Global Indices for Reforms and Growth (GIRG) initiative, the National Multidimensional Poverty Index (MPI) for India is aimed at leveraging the monitoring mechanism and methodology of the globally recognised MPI to rigorously benchmark national and subnational performance and drive programmatic actions and reforms.
- It is released by NITI Aayog
- Objectives:
- Enhanced high-level view of poverty at the national level
- Complements monetary poverty measures
- Information to shape policy
- Provides incentives for leaving no one behind and reaching the furthest behind first
- To track poverty over time
- To highlight “how” poor are the people in poverty
- To show the percentage of people who are multidimensionally poor
- To show the percentage of weighted deprivations the average multidimensionally poor person suffers from.
- Parameters are as follows:

Way forward:
- The ongoing task of ending poverty remains daunting.
- The Sustainable Development Goal target 1.2 is for countries to reduce at least by half the proportion of men, women, and children of all ages living in poverty in all its dimensions by 2030.
Source: Indian Express