The Big Picture- RSTV, UPSC Articles

Archives
TOPIC:
General Studies 1
- Indian Society
General Studies 2
- Economic policies
In News: Inequalities in access to bare necessities like drinking water, sanitation, hygiene and housing conditions continue to exist between urban and rural India despite “widespread” improvements in each of these aspects, the Economic Survey for 2020-21 has shown, using a newly constructed “Bare Necessities Index” (BNI).
What is Bare Necessities Index?
The BNI builds on the idea of Thalinomics in the Economic Survey for 2019-20, through which it had sought to examine the access to food in the country.
The BNI summarises 26 indicators on five dimensions –
- Water,
- Sanitation,
- Housing,
- Micro-environment and
- Other facilities
It has been created for all states for 2012 and 2018 using NSO data.
The index classifies areas on three levels of access-high, medium, low to bare necessities.
The Survey has underlined the need to focus on reducing variations in the access to bare necessities across states, between rural and urban areas, and between income groups.
Key Takeaways from the Survey
- In most of the States the access to the Bare Necessities for the household in 2018 is significantly better compared to 2012.
- Access to drinking water to households in most of the States has improved in 2018 compared to 2012 in rural as well as urban areas.
- Regional disparity in access to sanitation has declined as the States having low access to sanitation in 2012 have gained more.
- Survey observes improvement in Housing Index and reduction in inter-States disparities with disproportionate benefits for the lowest income group in 2018 vis-à-vis 2012.
- The economic Survey also notes improvement in micro environment for all States in 2018 except for Assam in rural and Odisha and Assam in urban areas as compared to 2012.
- Survey also points to a positive correlation between access to bare necessities and better health and education outcome. It observes improvement in child survival, decline in still births, malnutrition, and infant mortality with improved access to sanitation and clean drinking water.
Government schemes such as the Jal Jeevan Mission, SBM-G (Swachh Bharat Mission-Gramin), PMAY-G (Pradhan Mantri Awaas Yojana), may design appropriate strategy to address these gaps to enable India to achieve the SDG (UN Sustainable Development Goals) goals of reducing poverty, improving access to drinking water, sanitation and housing by 2030. There should be effective targeting of the needier population be they in urban or rural areas or across states.
Key Results
A BNI value has a range of 0 to 1, with 0 being the least desirable and 1 being the most desirable score. A map on the survey shows that BNI has tremendously improved in the country between 2012 and 2018.
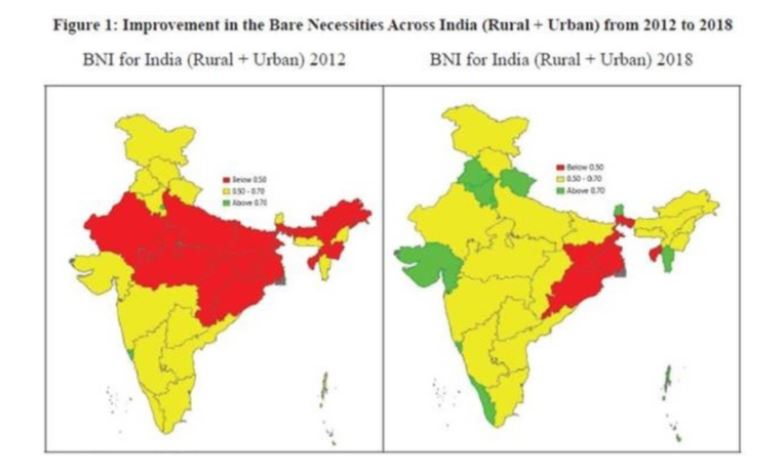
In 2018, access to bare necessities was the highest in states such as Kerala, Punjab, Haryana, and Gujarat, and lowest in Odisha, Jharkhand, West Bengal and Tripura, the Survey has said. In terms of urban-rural divide, all states barring Delhi, Punjab, Goa, Kerala, and Sikkim had medium or low access to bare necessities in their rural areas. In 2012, only rural Delhi had high access to bare necessities.
In 2018, the lowest access in rural India was recorded in Uttar Pradesh, Madhya Pradesh, Bihar, Jharkhand, West Bengal, Odisha, Assam, Manipur, and Tripura.
J&K, Punjab, Rajasthan, Gujarat, Maharashtra, Karnataka, Chhattisgarh, Tamil Nadu, Andhra Pradesh, Kerala, Goa, Meghalaya, and Arunachal Pradesh showed improvement in access to bare necessities in rural areas between 2012 and 2018.
Between 2012 and 2018, access to bare necessities for the poorest households improved disproportionately more when compared to the richest households, across both rural and urban areas. “The improvement in equity is particularly noteworthy because while the rich can seek private alternatives, lobby for better services, or if need be, move to areas where public goods are better provided for, the poor rarely have such choices,” the Survey noted.
Connecting the Dots
- Critically examine the ‘Bare Necessities Index’ approach.