Social Issues
In News: NFHS – Highlights
Child Nutrition
- The survey has found that 89 per cent of children between the formative ages of 6-23 months do not receive a “minimum acceptable diet’’
- This is only marginally better than the 90.4 per cent recorded in NFHS-4.
- Among all states and Union Territories, the proportion of children aged 6-23 months who received a minimum acceptable diet was highest in Meghalaya (28.5 per cent) and the lowest in UP and Gujarat (5.9 per cent each).
- Apart from Gujarat and UP, 5 other states Assam (7.2 per cent), Rajasthan (8.3 per cent), Maharashtra (8.9 per cent), Andhra Pradesh (9 per cent), MP (9 per cent) recorded a lower than national-level proportion (11 per cent) of children receiving adequate diet.
- Among the top-five states where the percentage of children from 6-23 months receiving adequate diet was highest, Meghalaya was followed by Sikkim (23.8 per cent), Kerala (23.3 per cent), Ladakh (23.1 per cent) and Puducherry (22.9 per cent).
- The minimum acceptable diet is a composite of two main things: breastfeeding and its frequency up to two years, and dietary diversity.
- A child needs at least four of the food groups indicated by the WHO every day to have a minimum acceptable diet
- Deficiency in diet in a child’s formative years has a direct bearing on malnutrition. This is the most direct indicator of child malnutrition — stunting, wasting and underweight children — and India has one of the highest malnutrition burdens in the world
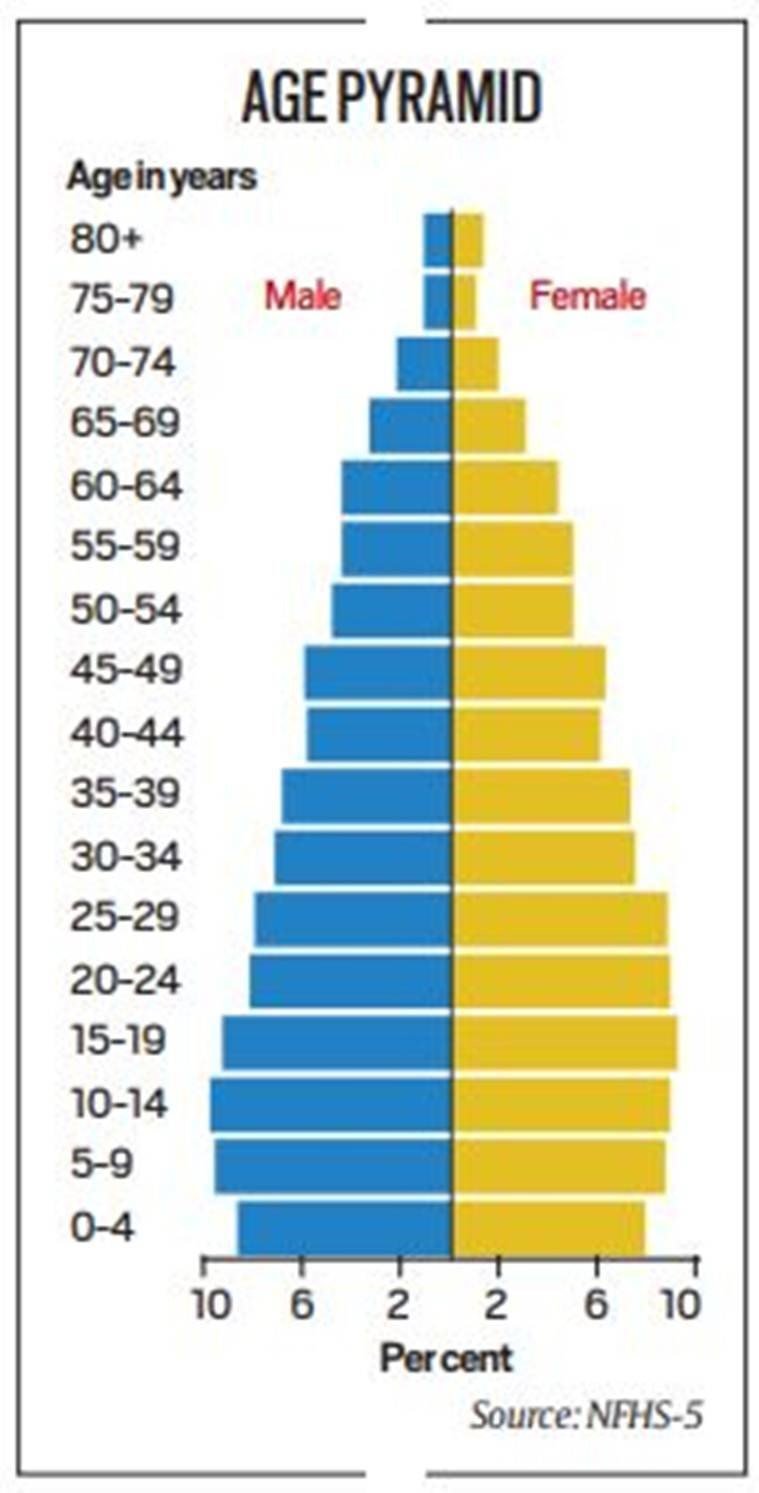
Age Pyramid of India
- India’s population remains young, with more than one-fourth aged less than 15 years and less than an eighth over 60
- There has been only a slight dip in the young, the under-15 population has declined by 2 percentage points, from 29% to 27%, while the over-60 population has increased by as many points, from 10% to 12%.
- Over half the population (52%) is below 30, compared to 55.5% in NFHS-4.

- The age pyramid shows India’s population is young, which, NFHS-5 notes, is typical of developing countries with low life expectancy.
Households
- The average household size has decreased slightly between 2015-16 and 2019-21 (from 4.6 persons to 4.4).
- Just over one-sixth of households (18%) have female heads, up from 15% in NFHS-4.
Previous Year Questions (PYQs)
Q.1) As per the NSSO 70th Round “Situation Assessment Survey of Agricultural Households”, consider the following statements (2018)
- Rajasthan has the highest percentage share of agricultural households among its rural households.
- Out of the total agricultural households in the country, a little over 60 percent belong to OBCs.
- In Kerala, a little over 60 percent of agricultural households reported to have received maximum income from sources other than agricultural activities.
Select the correct answer using the code given below.
- 2 and 3
- 2 only
- 1 and 3
- 1, 2 and 3
Q.2) Which of the following statements is/are correct regarding the Monetary Policy Committee (MPC)? (2017)
- It decides the RBI’s benchmark interest rates.
- It is a 12-member body including the Governor of RBI and is reconstituted every year.
- It functions under the chairmanship of the Union Finance Minister.
Select the correct answer using the code given below :
- 1 only
- 1 and 2 only
- 3 only
- 2 and 3 only
Source: Indian Express & Indian Express


