Environment & Ecology
In News: An analysis by the environmental think tank, Centre for Science and Environment, reported “barely any difference” in trends in particulate matter pollution (PM2.5) between the group of cities under the National Clean Air Programme (NCAP) and those outside its ambit.
- It covers 132 of India’s most polluted or so-called non-attainment cities.
- This is defined as a city whose air quality did not meet the national ambient air quality standards of 2011 to 2015.
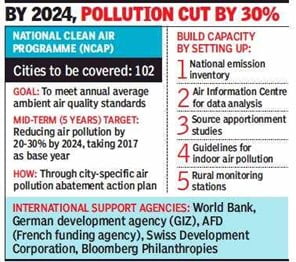
- The NCAP launched in 2019 aims to bring a 20%-30% reduction in pollution levels from PM2.5 and PM10 particles by 2024, using 2017 pollution levels as a base.
- The CSE in its national analysis of PM2.5 levels in cities for which data is available found that between 2019 and 2021, only 14 of 43 (NCAP) cities registered a 10% or more reduction in their PM2.5 level between 2019 and 2021.
- On the other hand, out of 46 non-NCAP cities, 21 recorded significant improvement in their annual PM2.5 value with 5% or more decline between 2019 and 2021.
- There is hardly any difference between the performance of NCAP and non-NCAP cities between 2019 and 2021.
- Cities in Punjab, Rajasthan and Maharashtra dominated the list of cities which registered a significant increase in PM2.5 levels between 2019 and 2021.
- The cities of Haryana, Madhya Pradesh and Gujarat dominate the list of non-NCAP cities that have registered significant increase in air pollution levels.
National Clean Air Programme (NCAP)
It was launched by the MoEFCC in January 2019 as a long-term, time-bound, national level strategy that features:
- Making determined efforts to deal with the air pollution problem across the country in a comprehensive manner.
- Achieving 20% to 30% reduction target in Particulate Matter concentrations by 2024 where 2017 is kept as the base year for the comparison of concentration.
- Identification of 122 non-attainment cities across the country based on the 2014-2018 Air Quality data.
- Non- Attainment Cities are the cities which do not meet the National Ambient Air Quality Standards.

- Preparation of the city specific action plans including measures to strengthen the monitoring network, reduce vehicular/industrial emissions, increase public awareness
- Implementation of the city specific action plans to be regularly monitored by Committees at Central and State level namely Steering Committee, Monitoring Committee and Implementation Committee.
- Facilitating collaborative, multi-scale and cross-sectoral coordination between the relevant central ministries, state governments and local bodies.
- Establishing a right mix with the existing policies and programmes.
- Increasing number of monitoring stations in the country including rural monitoring stations, technology support.
- Emphasis on awareness and capacity building initiatives.
- Setting up of certification agencies for monitoring equipment, source apportionment studies, emphasis on enforcement, specific sectoral interventions etc.
National Ambient Air Quality Standards
- National Ambient Air Quality Standards are the standards for ambient air quality set by the Central Pollution Control Board (CPCB)
- The CPCB has been conferred this power by the Air (Prevention and Control of Pollution) Act, 1981.
- Ambient Air Quality Standards contains 12 pollutants.
The pollutants that are covered under the National Ambient Air Quality Standards include:
- Sulphur dioxide (SO2),
- Nitrogen dioxide (NO2),
- The particulate matter having a size less than 10 microns (PM10),
- The particulate matter having a size less than 2.5 microns (PM2.5),
- Ozone
- Lead
- Carbon monoxide (CO)
- Arsenic
- Nickel
- Benzene
- Ammonia, and
- Benzopyrene
Source: The Hindu
Previous Year Question
Q.1) In the context of WHO Air Quality Guidelines, consider the following statements: (2022)
- The 24-hour mean of PM2.5 should not exceed 15 ug/m3 and annual mean of PM2.5 should not exceed 5 ug/m3.
- In a year, the highest levels of ozone pollution occur during the periods of inclement weather.
- PM10 can penetrate the lung barrier and enter the bloodstream.
- Excessive ozone in the air can trigger asthma.
Which of the statements given above are correct?
- 1, 3 and 4
- 1 and 4 only
- 2, 3 and 4
- 1 and 2 only


