IASbaba's Daily Current Affairs Analysis

Archives
(PRELIMS Focus)
Category: Defence and Security
Context:
- Recently, ‘Anjadip’, the third of eight ASW SWC (Anti-Submarine Warfare Shallow Water Craft), was delivered to the Indian Navy at Chennai.
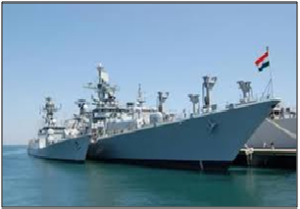
About Anjadip Ship:
- Nature: It is the third of eight Anti-Submarine Warfare Shallow Water Craft.
- Construction: It is indigenously designed and built by Garden Reach Shipbuilders and Engineers (GRSE), Kolkata, in collaboration with L&T Shipyard, Kattupalli, under a Public-Private Partnership (PPP).
- Nomenclature: The ship derives its name from Anjadip Island located off the coast of Karwar, Karnataka.
- Legacy: The ship is a reincarnation of the erstwhile INS Anjadip, a Petya class Corvette decommissioned in 2003.
- Role: It is primarily designed for sub-surface surveillance in coastal waters, anti-submarine operations, mine-laying, and Low Intensity Maritime Operations (LIMO).
- Capacity: It has displacement capacity of 900 tons with a maximum speed of 25 knots and an endurance of 1,800 nautical miles.
- Uniqueness: It is the largest Indian Naval Warship propelled by Waterjets, which are equipped with state-of-the-art Lightweight Torpedoes, indigenously designed Anti-Submarine Rockets and shallow water SONAR.
- Indigenisation: The ship stands as a testament to the growing domestic defence manufacturing ecosystem. It boasts over 80% indigenous content, aligning with the ‘Aatmanirbhar Bharat’ and ‘Make in India’ initiatives.
- Significance: The ship will strengthen Navy’s Anti-Submarine, coastal surveillance and mine laying capabilities.
Source:
Category: Economy
Context:
- Recently, soil tests in Kuttanad, the rice bowl of Kerala revealed dangerously high aluminium concentrations in paddy fields, posing a serious threat to crop health.
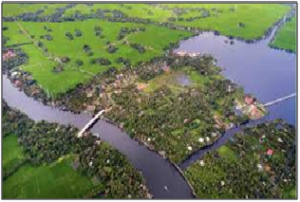
About Kuttanad Wetland Agricultural System:
-
- Geography: It is located in the Alappuzha, Kottayam, and Pathanamthitta districts of Kerala.
- Part of Ramsar site: It is part of the Vembanad-Kol wetland system, a designated Ramsar Site since 2002.
- Uniqueness: It is unique and the only system in India that favours rice cultivation below sea level. The cultivation takes place 1 to 2 meters below mean sea level.
- Complex system: Farmers reclaim land by draining delta swamps and building a complex network of polders (Padasekharams) and bunds to manage water and salinity.
- Concerns: The system faces severe threats from rising sea levels, saltwater intrusion, and chemical pollution from both agriculture and tourism. Further, frequent flood-drought cycles are threatening the Puncha (summer) rice season, the primary cultivation period.
- Structure: It is a mosaic of three distinct agricultural landscapes:
- Paddy Wetlands: Used for rice cultivation (locally called Puncha Vayals) and seasonal fish catching.
- Garden Lands: Used for planting coconut, tubers, and food crops.
- Water Bodies: Used for inland fishing and shell harvesting
Global and National Recognition:
- GIAHS Status: It is recognized by the Food and Agriculture Organization (FAO) in 2013 as a Globally Important Agricultural Heritage System (GIAHS).
- Rice Bowl of Kerala: It contributes significantly to Kerala’s rice production, often referred to by this sobriquet.
- Kuttanad Package: It is a major revival program recommended by the M. S. Swaminathan Research Foundation (MSSRF) to address ecological and agrarian distress in the region.
Source:
Category: Geography
Context:
- Recently, scientists found that the Southern Ocean mitigates global surface warming by taking up a large portion of the carbon released by human activities.
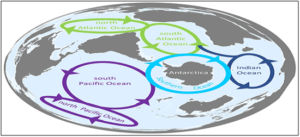
About Southern Ocean:
- Size: The Southern Ocean is the world’s fourth-largest (or second-smallest) ocean.
- Depth: Its deepest point is the Factorian Deep (approx. 7,434m) in the South Sandwich Trench.
- Location: The International Hydrographic Organization describes the Southern Ocean as the World Ocean’s southernmost portion. It is located on the lower end of the Pacific, Atlantic, and Indian Ocean, and includes the tributary seas around the Antarctic region.
- Recognition: On World Ocean Day (June 8, 2021), National Geographic recognized the Southern Ocean as the 5th ocean.
- Formation: It was formed around 34 million years ago when Antarctica and South America drifted apart, creating the Drake Passage.
- Distinctive features: It is known for its strong winds, intense storms, dramatic seasonal changes and cold temperatures.
- Uniqueness: It is dominated by the Antarctic Circumpolar Current (ACC) which is the longest, strongest, deepest-reaching current on earth.
- Biodiversity: Powerful currents, cold temperatures and nutrient and oxygen-rich waters make the Southern Ocean one of the most productive marine ecosystems on Earth.
- Significance: It plays an important role in the circulation of water around the globe. It also plays a key role in regulating the earth’s climate through its currents, seasonal sea ice and by absorbing heat and carbon dioxide from the atmosphere.
Source:
Category: Science and Technology
Context:
- Recently, NASA lost contact with its MAVEN spacecraft that has worked for more than a decade to study how the planet’s atmosphere is escaping into space.

About MAVEN Spacecraft:
-
- Nature: It is part of NASA’s Mars Exploration Program, an unprecedented, multi-decade campaign to comprehensively understand Mars and its suitability to host past or present life.
- Objective: It aims to understand the role that loss of atmospheric gas to space played in changing the Martian climate over time.
- Launch: It was launched in November 2013 and arrived at Mars in September 2014.
- Launch vehicle: It was launched using Atlas V.
- Uniqueness: It is the first spacecraft mission dedicated to surveying the upper atmosphere of Mars.
- Orbit: It orbits Mars every 3.5 hours and gets as close as 150 km to its surface.
- Payloads: It carries three main instrument packages:
- Solar Wind Package: It studies solar wind and its impact on the ionosphere.
- Ultraviolet Spectrometer: It observes the upper atmosphere.
- Mass Spectrometer: It analyses the composition of the upper atmosphere.
Recent discoveries:
-
- Loss of atmosphere: MAVEN confirmed that Mars lost about two-thirds of its early atmosphere primarily due to solar wind stripping, which transformed it from a warm, wet planet into a cold desert.
- Plasma Waves: Scientists from the Indian Institute of Geomagnetism used MAVEN data to identify high-frequency plasma waves in the Martian atmosphere, aiding our understanding of how electrons behave in the absence of a magnetic field.
- Auroras: MAVEN detected planet-wide “patchy” auroras caused by solar wind penetrating deeply into the atmosphere, unlike Earth’s localized polar auroras
Source:
Category: Environment and Ecology
Context:
- Recently, Vivek Menon became the first Asian chairman of the IUCN Species Survival Commission.
About IUCN Species Survival Commission:
-
- Nature: It is a science-based global network of over 10,000 volunteer experts (biologists, conservationists, etc.) providing technical advice on species conservation.
- Objective: Its primary role is to provide scientific data for the IUCN Red List of Threatened Species, the global gold standard for extinction risk assessment.
- Headquarters: Its headquarters is located in Gland, Switzerland.
- Structure: It functions as one of the six expert Commissions of IUCN. It works closely with the IUCN Secretariat and national governments, NGOs, and research institutions.
- Mechanism: It operates through more than 160 Specialist Groups (e.g., Cat Specialist Group, Asian Elephant Specialist Group), Task Forces, and Red List Authorities.
- Focus areas:
-
-
- To prevent species extinctions and support recovery of threatened species.
- To ensure that use of biodiversity is equitable and sustainable.
- To integrate science, policy, and on-ground action for global conservation.
-
- Significance:
-
- It forms the scientific backbone of global biodiversity governance.
- It guides national laws, protected area policies, and international conventions such as CBD and CITES.
- It serves as the global gold standard for extinction risk assessment.
Source:
(MAINS Focus)
(UPSC GS Paper II – International Relations: Bilateral, Regional and Global Groupings; GS Paper III – Indian Economy: External Sector)
Context (Introduction)
India’s recently concluded Free Trade Agreement (FTA) with New Zealand signals a calibrated shift in India’s trade strategy—prioritising sectoral safeguards, mobility, services and investment over headline tariff liberalisation.
Features
- Fast-Tracked but Cautious FTA: Negotiations launched in March 2025 were concluded by December 2025, making it one of India’s fastest FTAs. Total bilateral trade stood at just over USD 2 billion (FY 2024-25), but both sides aim to double it within five years.
- Comprehensive Market Access: New Zealand has agreed to zero-duty access on 100% of Indian exports (8,284 tariff lines) from entry into force. Average applied tariffs of ~2.2% on Indian goods will fall to zero, benefiting textiles, leather, engineering goods, pharmaceuticals, plastics and processed foods.
- Strategic Tariff Exclusions: India protected ~30% of tariff lines, notably dairy, sensitive agricultural products, sugar and select metals—addressing concerns that drove India’s exit from RCEP in 2019.
- Investment and Services Focus: New Zealand committed USD 20 billion investment over 15 years, moving the FTA beyond goods trade. It offers commitments across 118 services sectors, with MFN treatment in 139 sectors.
- Mobility and Education Breakthrough: A standout feature is a mobility pathway for 5,000 skilled Indian professionals at any given time (three-year visas) in IT, healthcare, education, construction and iconic occupations (AYUSH practitioners, yoga instructors, chefs). New Zealand also allows uncapped Indian student entry, 20-hour weekly work rights, and extended post-study visas—far exceeding precedents like Australia-India ECTA’s limited working-holiday quotas.
Why This FTA Matters: Key Gains
- People-Centric Trade Architecture: By combining mobility, education, and services with trade, the FTA creates a deeper socio-economic bridge, leveraging a 300,000-strong Indian diaspora (~5% of New Zealand’s population).
- Agriculture with Protection: Action Plans for apples, kiwifruit and honey pair tariff-rate quotas with technology transfer, Centres of Excellence and capacity-building—balancing farmer protection with productivity gains.
- MSME and Employment Boost: Zero-duty access for labour-intensive sectors (textiles, leather, footwear, gems & jewellery) strengthens India’s export competitiveness and job creation.
- Rules-Based Facilitation: Commitments on customs clearance (48 hours; 24 hours for perishables), electronic documentation, robust rules of origin, and expedited pharma regulatory pathways reduce non-tariff frictions.
Issues and Challenges
- Non-Tariff Barriers (NTBs): Recognition of Indian qualifications, quality standards, and conformity assessments will determine real gains—often the Achilles’ heel of FTAs.
- Awareness and Utilisation: Past FTAs show low utilisation due to lack of awareness among MSMEs; proactive outreach is essential.
- Implementation Capacity: Delivering agriculture Action Plans, TRQ monitoring, and services mobility requires sustained inter-ministerial coordination.
- Modest Trade Base: With low starting trade volumes, headline gains may appear limited unless firms actively integrate into Oceania supply chains.
Way Forward
- Make It a Template, Not an Exception: Replicate the NZ model—selective tariff liberalisation, strong services and mobility clauses, investment commitments, and sectoral safeguards—in future FTAs.
- Aggressive NTB Resolution: Set up joint working groups for standards, mutual recognition and rules-of-origin compliance.
- Sector-Focused Promotion: Target MSMEs, education providers, healthcare firms and IT services to fully leverage preferences.
- Leverage for Pacific Outreach: Use New Zealand as a gateway to Oceania and Pacific Island markets, aligning with India’s Indo-Pacific strategy.
Conclusion
The India–New Zealand FTA reflects a mature, interest-driven trade diplomacy—balancing openness with protection, and goods with people-centric mobility. Its success will hinge on implementation and NTB removal, determining whether it becomes a durable template for India’s future FTAs.
Mains Question
- India’s Free Trade Agreement with New Zealand marks a shift in India’s trade strategy. Examine its key features and assess how it can serve as a template for India’s future trade agreements.(250 words, 15 marks)
Source: The Hindu
(UPSC GS Paper I – Society: Women, Work & Demography; GS Paper III – Indian Economy: Employment, Skill Development, Technology)
Context (Introduction)
Recent Time Use Survey data reveal that Indian women face severe time poverty due to unpaid care work, limiting their ability to upskill—an inequality that risks deepening women’s exclusion from quality employment in an AI-driven economy.
Current Status: Women’s Labour Force Participation and Time Use
- Low and Uneven Workforce Participation: India’s female labour force participation rate (FLFPR) stands at around 40% (Time Use Survey, 2024; PLFS trends)—significantly below global averages. Importantly, much of this rise is driven by unpaid family work and low-paid self-employment, not secure wage employment.
- Double Burden of Work: According to the Ministry of Statistics and Programme Implementation Time Use Survey (2024), working women spend ~9.6 hours per day on combined paid and unpaid work, compared to ~8.6 hours for men.
- Women’s total work exceeds 70 hours per week during prime working ages (25–39 years).
- Men’s work hours remain largely within 54–60 hours per week, with over 80% devoted to paid work.
- Unpaid Care as the Core Constraint: Women spend significantly more time on childcare, eldercare, cooking, cleaning, and household management, while men’s unpaid work remains low and stable across life stages.
- Severe Time Deficit for Skill Development: Women spend 10 hours less per week than men on self-development, including education, skill enhancement, and well-being. The gap widens to 11–12 hours during prime career years—precisely when upskilling is most critical.
Why Women’s Low LFPR Persists: Structural Reasons
- Household Responsibilities as Primary Barrier: The Periodic Labour Force Survey (PLFS) consistently shows that ~40% of women outside the labour force cite domestic duties as the main reason for non-participation.
- Lack of Care Infrastructure: Limited access to affordable childcare, elderly care, piped water, clean cooking fuel, and safe transport increases unpaid work burdens.
- Informality and Job Quality: Women are overrepresented in informal, low-productivity, and insecure jobs, offering limited returns to skill investment.
- Social Norms and Gender Roles: Care work remains feminised, regardless of income, education, or urbanisation, reinforcing unequal time allocation.
How AI and Automation Exacerbate the Situation
- Higher Automation Risk: Women are disproportionately employed in routine, low-skill tasks—clerical work, basic services, and informal activities—that are more susceptible to AI-led automation.
- Upskilling Requires Time—Women Lack It: AI transitions demand continuous learning. However, women’s time poverty directly restricts access to reskilling, locking them into low-value work.
- Algorithmic Bias Against Caregivers: AI-driven productivity metrics often ignore unpaid care responsibilities, potentially penalising women for career breaks, flexible hours, or lower availability.
- GDP Underestimation of Women’s Work: Women contribute only ~17% to India’s GDP, not due to low effort, but because unpaid labour—central to social reproduction—is excluded from national accounts.
Policy Tools and Government Initiatives
- Gender Budgeting: India’s gender budget remains below 1% of GDP, limiting its transformative potential. Time-use data is not systematically integrated into budget design.
- Skill and AI Missions: Initiatives such as India AI Mission and AI Careers for Women aim to expand women’s participation in emerging tech, but scale and accessibility remain limited.
- Care Economy Programmes: Schemes like Anganwadi services exist, but coverage, quality, and urban applicability remain inadequate for working women.
Way Forward
- Recognise Time Poverty as an Economic Constraint: Explicitly integrate Time Use Survey data into labour, skill, and industrial policies.
- Invest in Time-Saving Infrastructure: Expand affordable childcare, elderly care, piped water, clean energy, and safe public transport—shown globally to raise women’s labour participation.
- Flexible and Lifelong Upskilling Models: Design modular, local, digital, and flexible training programmes aligned with women’s time and mobility constraints.
- Outcome-Based Work Cultures: Encourage employers to move from hours-based to outcome-based evaluation, supported by the right to disconnect and flexible work norms.
- Revalue Care Work: Progressively account for unpaid care in economic planning and explore compensation, social security, or service substitution models.
Conclusion
India’s low female labour force participation is not a supply problem but a time poverty problem. In the AI era, where skills determine survival, women’s unpaid labour and lack of time risk becoming the biggest structural barrier to inclusive growth. Unless women’s time is freed, valued, and mainstreamed into policy, India’s Viksit Bharat 2047 vision will remain fundamentally constrained.
Mains Question
- Time poverty is a major but under-recognised factor behind India’s low female labour force participation. Examine how unpaid care work limits women’s upskilling and employment prospects. Suggest policy measures to address this challenge.(250 words, 15 marks)
Source: The Hindu
(UPSC GS Paper III – Indian Economy: Growth, Industrialisation, Employment, Regional Development)
Context (Introduction)
Recent export data show strong national performance, but a disaggregated analysis reveals rising regional concentration and weak employment outcomes, questioning the long-held assumption that export growth automatically drives broad-based industrialisation and labour absorption.
Current Status: Exports Concentrated in a Few States
- High Regional Concentration: Data from the Reserve Bank of India Handbook of Statistics on Indian States (2024–25) show that five States — Maharashtra, Gujarat, Tamil Nadu, Karnataka and Uttar Pradesh — account for nearly 70% of India’s total exports, up from about 65% five years ago.
- Core–Periphery Export Geography: India’s export engine is increasingly concentrated in the western and southern coastal belt, while large parts of northern and eastern India remain weakly integrated into global trade.
- Rising Concentration Index: The rising Herfindahl–Hirschman Index (HHI) of export geography indicates agglomeration rather than diffusion of export capacity.
- Misleading National Averages: Aggregate export growth masks deepening inter-State divergence, giving an impression of broad-based success while lagging regions decouple from trade-led growth.
Reasons for Export Concentration Across States
- Agglomeration and Supply-Chain Clustering: Firms gravitate towards States with established ports, logistics, supplier networks and skilled labour pools, reinforcing first-mover advantages.
- Financial Asymmetry: RBI Credit–Deposit (CD) ratios exceed 90% in export hubs like Tamil Nadu and Andhra Pradesh, indicating strong recycling of local savings into local industry. In contrast, States like Bihar and eastern Uttar Pradesh remain below 50%, reflecting capital flight from hinterland to coastal cores.
- Human Capital and State Capacity Gaps: Low-export States face persistent deficits in education, health, skills, logistics and industrial governance, constraining their entry into high-value export ecosystems.
- Global Capital Preferences: In today’s trade environment, capital seeks economic complexity and ecosystem depth, not merely low-cost labour — advantages concentrated in already industrialised States.
Why the Export-Led Model Is Losing Its Transformative Power
- Slowing Global Trade Volumes: According to the World Trade Organization, global merchandise trade growth has structurally slowed to 0.5–3%, narrowing space for late industrialisers.
- Global Export Concentration: The UN Trade and Development (2023) reports that the top 10 exporters control about 55% of global merchandise trade, raising entry barriers.
- Capital-Intensive Export Growth: Data from the Annual Survey of Industries (2022–23) show fixed capital growing faster (10.6%) than employment (7.4%), with capital per worker rising to ₹23.6 lakh, indicating automation and capital deepening.
- Stagnant Manufacturing Employment: The Periodic Labour Force Survey shows manufacturing employment stuck at ~11.6–12% of total workforce, despite record export values.
- Collapse of Employment Elasticity: Exports are increasingly generating value without volume of jobs, bypassing the labour-intensive industrialisation phase that underpinned East Asian growth.
- Exports as Outcome, Not Driver: States export not because exports create development, but because they already possess industrial depth — reversing the classic development sequence.
Way Forward: Rethinking Exports and Industrial Strategy
- Move Beyond Export Value Metrics: Track employment elasticity, wage share, regional diffusion and economic complexity, not just export volumes.
- Target Hinterland State Capacity: Invest in logistics, industrial infrastructure, skills, urban clusters and governance capabilities in low-export States.
- Correct Financial Imbalances: Improve CD ratios in hinterland States so local savings finance local productive investment.
- Labour-Absorbing Industrial Policy: Prioritise sectors with high employment multipliers alongside capital-intensive champions.
- Complexity-Building Approach: Enable gradual entry of lagging regions into dense “product spaces” through supplier development, technology diffusion and MSME upgrading.
Conclusion
India’s export growth increasingly reflects accumulated industrial advantage rather than serving as a pathway to inclusive development. Without reorienting export and industrial policy toward employment generation and regional convergence, exports risk deepening inequality instead of delivering structural transformation.
Mains Question
- India’s exports are increasingly concentrated in a few States, while their capacity to generate labour-intensive growth has weakened. Analyse the reasons for this trend and examine why the traditional export-led development model is losing relevance. Suggest a way forward.(250 words, 15 marks)
Source: The Hindu