UPSC Articles
ECONOMY/ GOVERNANCE
Topic: General Studies 2:
- Indian Economy and issues relating to planning, mobilization, of resources, growth, development and employment.
Historic Recession: On India’s GDP slump
Context: Provisional estimates of GDP for the second quarter of the 2020-21 show economic output shrank by 7.5%, following the 23.9% contraction in the first quarter.
The economy shrunk for a second successive quarter, marking a recession for the first time in independent India’s history.
Key Statistics
- The overall GDP figure of ₹33,14,167 crore (at 2011-12 prices) reveals output has slid back to the lowest level in 12 quarters.
- Private consumption expenditure — the single biggest component propelling GDP with a share exceeding 50% at constant prices and edging toward 60% in current prices — continued to shrink (-11.3%), reflecting both consumer wariness to spend amid the pandemic and the impact of lost jobs and reduced incomes.
- Government consumption spending that was hitherto a bulwark contracted by 22% revealing the precarious state of public finances.
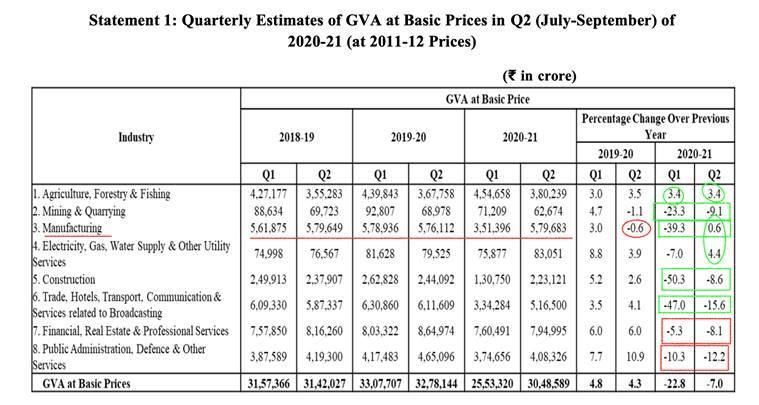
- In the real economy, electricity and other utility services joined agriculture in posting growth, expanding 4.4%, as the post-lockdown resumption of industrial activity lifted power and water consumption.
- Financial, real estate and professional services, which contribute about a fourth of the GVA, widened contraction from the first quarter, shrinking 8.3%

Figure 2: Source: Indian Express
However, the 7.5% decline data has been met with all-round cheers. That is counter-intuitive but not without justification.
- Better than expected results: The -7.5% figure is decidedly lower than most street estimates. The sharper-than-expected economic “recovery” —Q1 was 23.9% decline— has substantially changed how the Indian economy is being viewed.
- Better recovery than Global average: According to an analysis by the State Bank of India’s research team, 49 countries have declared GDP data for the July-Sept quarter. The average decline of these 49 countries is 12.4%. In comparison, India’s 7.5% looks much better.
- Economic recovery is fairly broad-based: Looking at the Gross Value Addition of each sector, as show in the figure 2, we see that as compared to just one sector adding positive value in Q1, three sectors added positive value in Q2 (green circles). Moreover, in three of the remaining five sectors, the rate of decline decelerated — highlighted in green boxes.
- Positive growth registered by India’s manufacturing industry: Part of this can be explained by a weak base — check out the minus 0.6% in Q2 of 2019-20. IIP manufacturing declined by 6.7% (average of Jul/Aug/Sep) while manufacturing GVA grew by 0.6%. This incongruence can be explained by companies increasing their incomes not by selling more but by ruthlessly getting rid of employees, which is not healthy sign and could undermine future demand.
- Hope of Positive growth rate by Q4: Most experts now expect that by Q4, the nominal GDP growth rate will recover so far that even after subtracting inflation rate, India would register positive real growth in at least the fourth quarter.
Conclusion
Government has to revive demand by enabling more money into the hands of consumers (cutting taxes, increasing subsidies) so as to bring back growth in the economy.


