UPSC Articles

AGRICULTURE / GOVERNANCE/ FEDERALISM
Topic: General Studies 2,3:
- Public Distribution System- objectives, functioning, limitations, revamping; issues of buffer stocks and food security
- Government policies and interventions for development in various sectors and issues arising out of their design and implementation.
Comparison of Govt’s Support for Agriculture
Context: Ongoing farmer protests while the government argues that the three farm laws are a logical extension of market reforms into India’s agriculture sector.
What are the arguments of farmers against newly enacted farm bills?
- Fear of losing Social Safety Net: For the protesting farmers — primarily belonging to Punjab and Haryana — there is a fear that new farm laws and allegations of dilution of MSP system will rob farmers of their traditional social safety net.
- Farming is viewed as fall back option: Farmers do not view farming merely as a “job” as many of us who are part of the modern economy often do. For them, farming is also the fall-back option when other ventures fail.
- Farming as only livelihood Option: For farmers, cultivation is not just about productivity metrics; it is also about an option for them to eke out a living, however meagre, when they find themselves unable to participate in the other sectors of the economy — industries and services sectors.
- This perhaps explains why two-thirds of the world’s second-most populous country lives in rural areas. Or why agriculture employs almost half of India (44%) despite contributing less than 15% to India’s GDP.
Does the Indian government support its farmers as much as some of the other comparable countries?
According to the data provided by Organisation for Economic Co-operation and Development (or OECD), the Indian farmers seem to have a genuine grouse.
Across countries, the OECD provides five sets of data on the issue of agriculture support and India trails on most counts.
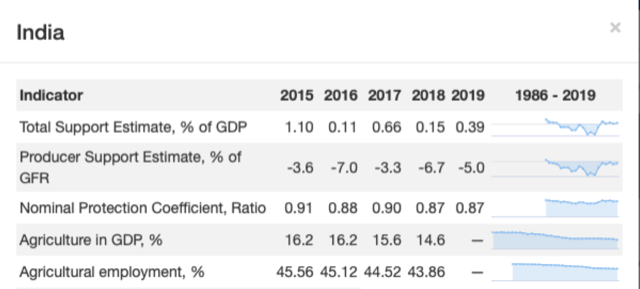
- Producer Support Estimates or PSEs
- These are transfers to agricultural producers and are measured at the farm gate level.
- They comprise market price support, budgetary payments and the cost of revenue foregone.
- Support to producers in India is composed of budgetary spending corresponding to 7.8% of gross farm receipts, positive market price support (MPS) of +2.0% of gross farm receipts among those commodities which are supported, and negative market price support of -14.8% among those which are implicitly taxed.
- Overall, this leads to negative net support of -5.0% of gross farm receipts (%PSE or producer support estimate) in 2019
- PSEs for USA was approx. +10% and EU was +20% .
- Consumer Support Estimates or CSE
- These refer to transfers from consumers of agricultural commodities.
- They are measured at the farm gate level. “If negative, the CSE measures the burden (implicit tax) on consumers through market price support (higher prices), that more than offsets consumer subsidies that lower prices to consumers,
- India’s CSE as a percentage of agricultural consumption, 2019 is at around 24%, while that of US, EU is at around +10% and -3% respectively.
- General services support (or GSSE)
- GSSE transfers are linked to measures creating enabling conditions for the primary agricultural sector through development of private or public services, institutions and infrastructure.
- GSSE includes policies where primary agriculture is the main beneficiary, but does not include any payments to individual producers. GSSE transfers do not directly alter producer receipts or costs or consumption expenditure
- India’s GSSE, in Million US Dollars 2019, was at around 17k, while that of USA, EU and China was at around 10K, 12K and 35K respectively.
- Total Support Estimate (or TSE)
- The TSE transfers represent the total support granted to the agricultural sector, and consists of producer support (PSE), consumer support (CSE) and general services support (GSSE).
- India’s TSE, measured as a percentage of GDP, in 2019 was nearly at 0.4%, while that of EU, China and Indonesia was at nearly 0.6%, 1.5% and 3% respectively.
- Producer protection
- The PP is the ratio between the average price received by producers (measured at the farm gate), including net payments per unit of current output, and the border price (measured at the farm gate).
- For instance, a coefficient of 1.10, which China has, suggests that farmers, overall, received prices that were 10% above international market levels.
Conclusion
- The negative value of the PSE reflects that domestic producers, overall, continue to be implicitly taxed, as budgetary payments to farmers do not offset the price-depressing effect of complex domestic regulations and trade policy measures.
- Mirroring the farm price-depressing effect on producers, the policies provide implicit support to consumers.
- In other words, contrary to the perception among many, the government has preferred the welfare of Indian consumers over the Indian farmers.