UPSC Articles

ECONOMY/ GOVERNANCE
- GS-3: Indian Economy and issues relating to planning, mobilization, of resources, growth, development and employment.
Analysis of Q1 Growth Data
Context: Recently, the Ministry of Statistics and Programme Implementation released the GDP (gross domestic product) and GVA (gross value added) data for the first quarter of the Financial Year 2021-22.
- The government used the Year-on-Year (Y-o-Y) comparison method — which showed that the GDP grew by 20% in Q1 this year as against the Q1 last year — to claim that India was witnessing a V-shaped recovery.
- Critics however, showed the economy contracted by 17% in Q1 this year as against Q4 (January, February and March) of the last financial year (2020-21) — to claim that the economy was fast losing momentum.
| Engines of Demand | 2017-18 | 2018-19 | 2019-20 | 2020-21 | 2021-22 |
| Private Final Consumption Expenditure (PFCE) | 17,83,905 | 18,89,008 | 20,24,421 | 14,94,524 | 17,83,611 |
| Government Final Consumption Expenditure (GFCE) | 3,63,763 | 3,93,709 | 3,92,585 | 4,42,618 | 4,21,471 |
| Gross Fixed Capital Formation (GFCF) | 9,89,620 | 10,82,670 | 12,33,178 | 6,58,465 | 10,22,335 |
| Net Exports | —1,44,175 | — 1,22,238 | — 1,70,515 | 34,071 | — 62084
|
| Total GDP* (an L-shaped recovery) | 31,62,537 | 33,59,162 | 35,66,708 | 26,95,421 | 32,38,020 |
| GDP for a V-shaped recovery | 31,62,537 | 33,59,162 | 35,66,708 | 26,95,421 | 40,07,553 |
Table 1: GDP (at 2011-12 Prices) in Q1 (April-June) of 2021-22 falls back to levels last seen in 2018 (In Rs Crore)
Analysis of the government Claim
- Table 1 shows that private consumption demand — the biggest driver of India’s GDP (accounting for more than 55% of all GDP) — is almost exactly back to where it was in 2017-18.
- However, the reduction in government spending pulled down the overall economic growth rate in Q1.
- If the government continues to believe that India has already staged a V-shaped recovery, it may not spend more, therefore creating a drag on future growth.
- Essentially, a V-shaped recovery means the economy quickly reverts to the trend of absolute GDP. Refer the graph given below.
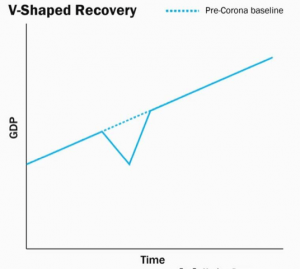
- So if India’s GDP was growing at 6% before the pandemic and we assume that it would have grown at 6% in 2020-21 and 2021-22 without the Covid disruption, then the Q1 GDP should have been Rs 40,07,553.
- In reality, it is only Rs 32,38,020. In other words, the actual GDP was in Q1 is 24% lower the expected trend level if it was V-shaped recovery. Assuming 7% (year-on-year) growth, it is estimated that Q1 data would take another 3 years to achieve the levels so as to claim V-shaped recovery.
- The reality — a Q1 GDP of Rs 32,38,020 — points more towards an “L-shaped” recovery instead of a “V-shaped” one.
The story is equally worrisome when one looks at the GVA data.
| Industry | 2017-18 | 2018-19 | 2019-20 | 2020-21 | 2021-22 |
| Agriculture, Forestry & Fishing | 4,04,433 | 4,27,177 | 4,49,390 | 4,65,280 | 4,86,292 |
| Mining & Quarrying | 95,928 | 88,634 | 82,914 | 68,680 | 81,444 |
| Manufacturing | 5,03,682 | 5,61,875 | 5,67,516 | 3,63,448 | 5,43,821 |
| Electricity, Gas, Water Supply & Other Utility Services | 67,876 | 74,998 | 79,654 | 71,800 | 82,042 |
| Construction | 2,42,588 | 2,49,913 | 2,60,099 | 1,31,439 | 2,21,256 |
| Trade, Hotels, Transport, Communication & Services related to Broadcasting | 5,63,038 | 6,09,330 | 6,64,311 | 3,45,099 | 4,63,525 |
| Financial, Real Estate & Professional Services | 7,28,068 | 7,57,850 | 8,02,241 | 7,61,791 | 7,89,929 |
| Public Administration, Defence & Other Services* | 3,57,203 | 3,87,589 | 3,99,148 | 3,58,373 | 3,79,205 |
| Total GVA
(L-shaped Recovery) |
29,62,815 | 31,57,366 | 33,05,273 | 25,65,909 | 30,47,516 |
| GVA for a V-shaped recovery | 29,62,815 | 31,57,366 | 33,05,273 | 25,65,909 | 36,44,063 |
Table 2: GVA (at 2011-12 Prices) in Q1 of 2021-22 (in Rs Crore)
- For some sectors that create the most jobs in India — such as Construction and Trade, Hotels, Transport, Communication & Services etc. — the picture is much depressing as the GVA levels have fallen back to 2017-18.
- Again, even if GVA grows by 7% (Y-o-Y) from here on, it will take another three years just to cross the level that marks a V-shape recovery this year.
What is the point of this analysis?
- The point of this analysis is to correct the misconception about the shape and form of the economic recovery so that the government can make smarter policy choices going forward.
- For instance, if there is a consensus that India suffers from weak consumer demand (as shown by the Private Final Consumption Expenditure (or PFCE) component in the GDP data table), then the government can boosting its spending through a cut in GST rates or taxes on petroleum products or providing tax relief.
- Increased money with people increases demand and boosts economic growth.
- Government should not make the mistake which it committed in 2020, when the economy was experiencing slowdown (India’s annual growth fell sharply from over 8% in 2016-17 to just about 4% in 2019-20.)
- The reason for the slowdown was weak demand (Private consumption). Instead of boosting people’s purchasing power by cutting taxes, government announced Corporate Tax cuts to boost supply. This did not help in revival of economy.
- Wrong analysis of situation & wrong solution is the mistake which the government should not commit this time.
Connecting the dots: