UPSC Articles

EDUCATION/ GOVERNANCE
Topic:
- GS-2: Government policies and interventions for development in Education sectors
- GS-2: Issues relating to development and management of Education, Human Resources
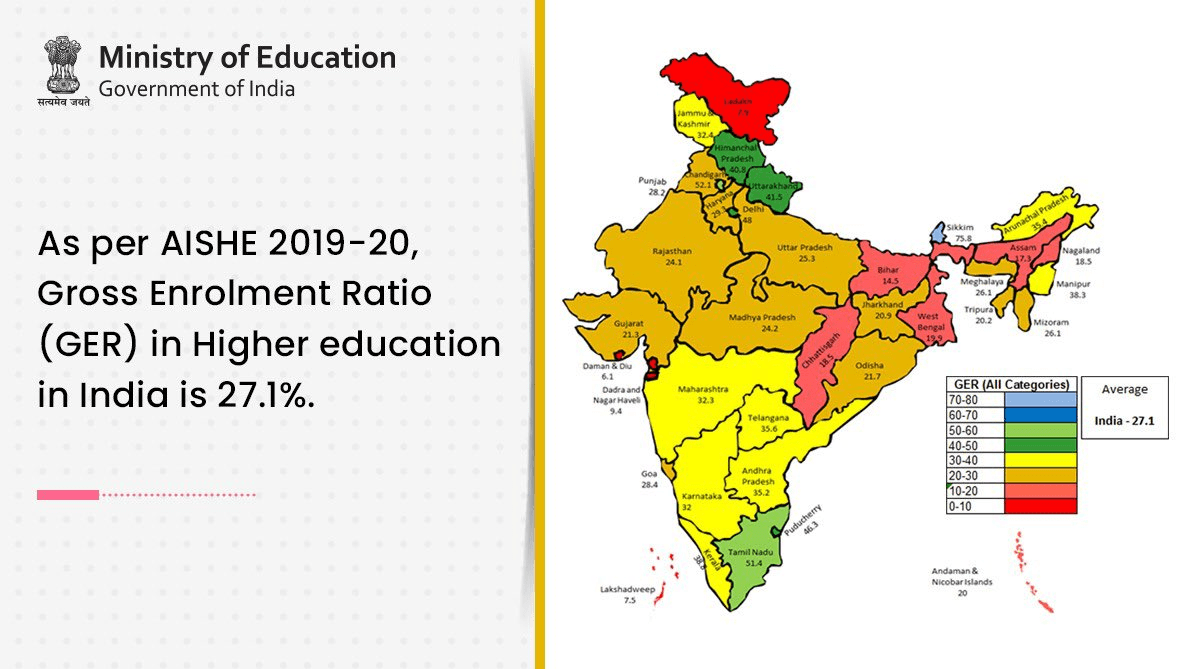
All-India Survey of Higher Education (AISHE) 2019-20
Context: The ministry of education released the findings of the All-India Survey of Higher Education (AISHE) for 2019-20 on June 10.
Key Highlights of the report
| Total Enrolment
In Higher Education |
Out of these, nearly 85% of the students (2.85 crore) were enrolled in the six major disciplines such as Humanities, Science, Commerce, Engineering & Technology, Medical Science and IT & Computer. |
| Gross Enrolment Ratio (GER) |
GER in higher education is calculated for the 18-23 age group. It is the ratio of enrolment in higher education to the population in the eligible age group. |
| Gender Parity Index (GPI) |
|
| Students Pursuing PhD |
|
| Total Number of Teachers |
|
However, the report also contains enough evidence to suggest that India’s higher education sector confronts serious issues of inequality across the gender, caste, and regional axis.
- Headline improvement in enrolment numbers hides access to professionally rewarding courses
- When it comes to accessing professionally rewarding education, caste and gender seem to be major determinants.
- The only professional courses — among the top 10 most pursued programmes at bachelor’s and master’s level — where women do better than men are BEd and MEd, which are usually pursued by aspiring school-teachers
- Multi-layered social inequality among teachers in Higher Education
- More than 40% of the teachers in India’s higher educational institutions are non-SC-ST-OBC Hindus. Their population share, as per the findings of the 2015-16 National Family and Health Survey (NFHS), is just 17.6%.
- Even in Institutes of National Importance, which include institutes such as IITs, NITs, AIIMS, and IIMs, the share of non-SC-ST-OBC Hindu teachers is more than 70%.
- The share of women at the demonstrator/tutor position in educational institutions is 65.5%, but it falls to 27.5% at the level of associate professor/professor.
- Geography matters as much as sociology
- Access to higher education varies significantly across states.
- GER is 15.8% and 13.1% for men and women in Bihar and 44.9% and 51.8% in Delhi.
- Regional Distribution of Government Colleges
- Only 8,565 of 39,955 colleges in India or about a fifth (21.4%) were government colleges in 2019-20. But there is wide regional variation in the share of government colleges across different states.
- In poorer states in the east, government colleges make up a third to half of educational institutions, while in southern and western states government colleges are less than a fifth of all colleges.
- Government colleges are almost as big a chunk of total colleges in Delhi (55.7%) as they are in Bihar (59.8%). This should make it clear that the public sector footprint is hardly an indicator of quality of education
Connecting the dots:
- National Education Policy (NEP), 2020: It aims at increasing the GER in higher education to 50% by 2035.